dstat is a tool for viewing resource use in Linux, it can be used to bench mark a system at rest and then run again to show the impact a particular piece of software may be having.
Installing dstat
I am using Raspbian and installed dstat using sudo apt install dstat, a sudo apt update may be needed.

Using dstat
If no flags (options) are given to dstat then it runs with the default of -cdngy which returns total CPU usage, disk read/write, network receive/send, paging and system stats. This is also the same as using the command dstat -a.

However, dstat can run with a variety of flags depending on what you want to monitor. The full list can be viewed using dstat -h.

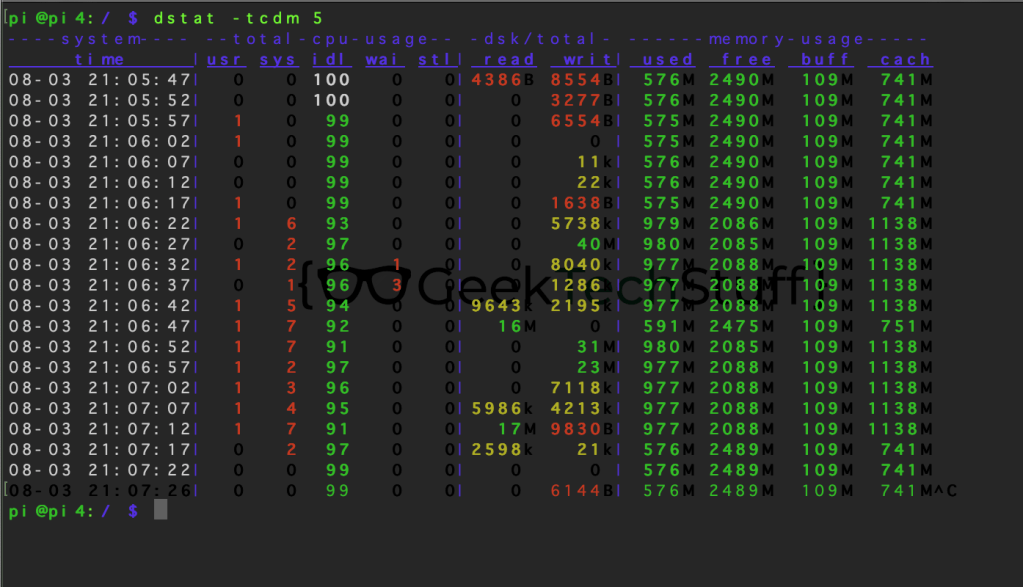
I personally like dstat -tdm, which is -t (time) -d (disk read/write) and -m (memory usage).

Another option for dstat is using its count option. By default dstat takes a reading every second, however using the count function can change this. For example. dstat 5 would take a reading every 5 seconds.

The below is an example of using dstat whilst a program (in this case the Raspberry Pi Agnostic tool) is running.


You must be logged in to post a comment.