
If you want to see metrics in real time and look at web dashboards then Grafana and Prometheus may be the tools you are looking for, and if you are anything like me then you probably want to automate as much of the install as possible via Ansible.
My Set Up
For this blog post I am using:
- Raspberry Pi 4 4GB (my current desktop device) running Raspberry Pi OS 32-bit
- Raspberry Pi 4 2GB (my dev test device) running Raspberry Pi OS 32-bit
- Ansible
- Grafana with Prometheus and Node Exporter
In the past I would have used virtual machines but my desktop PC is not doing too great and my Macbook has never been great at running more than one virtual. If you want to follow along with virtual machines please feel free to do so but please remember to choose the correct download for your OS/processor.
Note: I’m carrying out this work on my personal dev network, if you are going to use any of the below for production please make sure to secure it (e.g. SSL certs, service accounts on boxes).
Download Links
Grafana – https://grafana.com/grafana/download
Prometheus & Node Exporter – https://prometheus.io/download/
Ansible – https://www.ansible.com
What is Grafana?
Grafana is an analytics platform, allowing for data (e.g. metrics) to be queried, analysed and visualised in various ways, and shared via dashboards. Grafana can be used with a variety of data sources such as InfluxDB, Graphite, PostgreSQL, mySQL and Elastic, providing a web front end to the data. Grafana also ties into alerting and logs.
What is Prometheus / Node Exporter?
Prometheus is a data source that Grafana can link into. From the Prometheus.io website (link above):
“Prometheus’s main features are:
- a multi-dimensional data model with time series data identified by metric name and key/value pairs
- PromQL, a flexible query language to leverage this dimensionality
- no reliance on distributed storage; single server nodes are autonomous
- time series collection happens via a pull model over HTTP
- pushing time series is supported via an intermediary gateway
- targets are discovered via service discovery or static configuration
- multiple modes of graphing and dashboarding support”
Node Exporter is a Prometheus plug in which can send data to Prometheus, so that it can then be viewed and visualised in Grafana.
Plan
The Pi 4 2GB will run Grafana, Prometheus and Node Exporter, and then the other Pis on my network (starting with the Pi 4 4GB) will also run Node Exporter. I should then be able to quickly view stats about each device via the Grafana web front end.
Ansible Playbook
I am going to use Ansible to automate the installation (where possible) as I regularly find myself building, destroying and rebuilding my dev devices. An Ansible playbook saves time as I can run it have a development environment back up quicker (and generally more reliably) than manually reinstalling everything. Also with a few adjustments (e.g. changing the download to correct processor type) the playbook can be made to work with a variety of Linux environments.
The playbook and files are available on via my GitHub: https://github.com/geektechdude/Grafana_Ansible_Playbook
The following files are in use to install and set up Grafana, Prometheus and Node Exporter:
- inventory
Containing the connection details for the Raspberry Pis, username and SSH key details and with the Pis split into pi_master and pi_client.
- playbook.yml
Containing the details to call the tasks for the grafana, prometheus and node_exporter roles and telling Ansible which roles should be run on which host (Pi).
- roles/grafana/tasks/main.yml
Installs, configures and starts Grafana on port 3000.

- roles/prometheus/tasks/main.yml
Installs, configures and starts Prometheus on port 9090.
- roles/node_exporter/tasks/main.yml
Installs, configures and starts Node Exported on port 9100.
Note: On the device running Prometheus, the prometheus.yml file needs editing to add the sources of the devices running Node Exporter under the static_configs using a line for each reading:
- targets:['IP ADDRESS:9100']
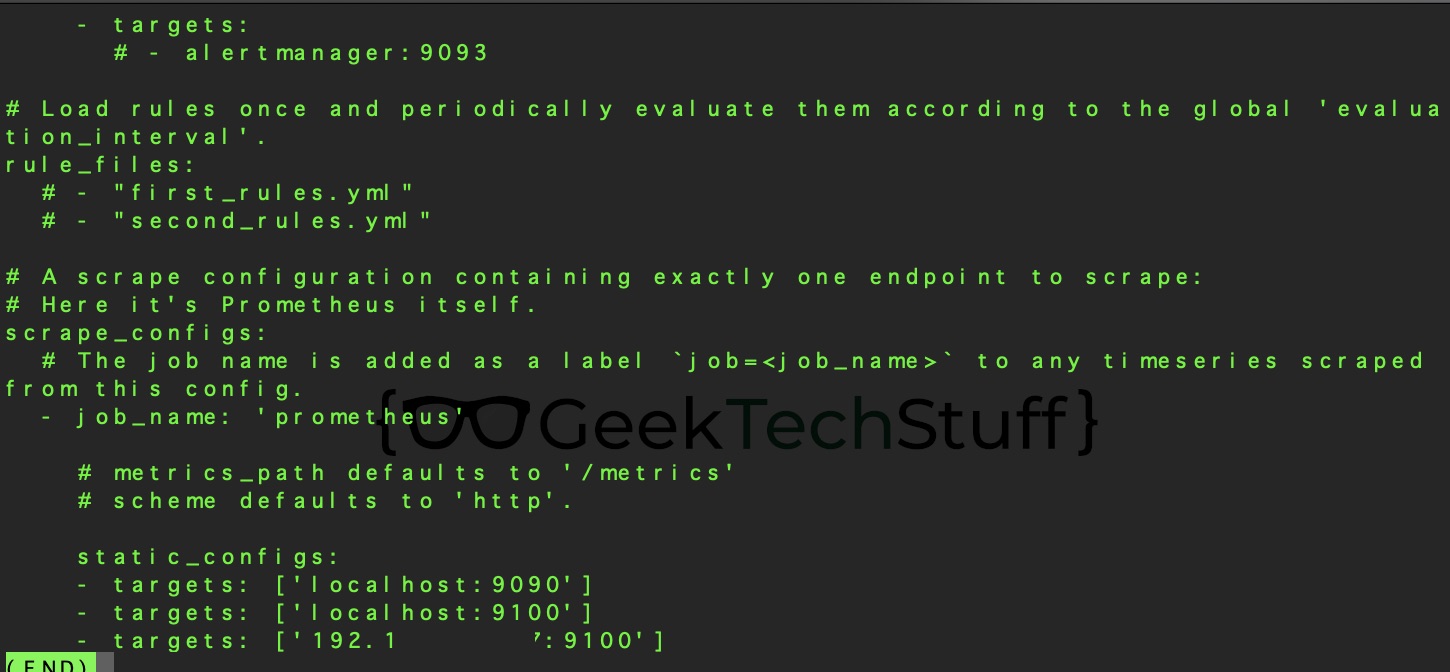
I aim to resolve this in a future version of my Ansible playbook.
Adding Dashboards To Grafana
The final step is amending the Grafana web front end to show the data. Open Grafana (http://IP ADDRESS OF DEVICE RUNNING GRAFANA:3000), login (default username and password is admin) and click the settings cog>add data source, or if you have the “Welcome to Grafana” dash click “Add Your First Data Source”. Choose Prometheus and enter the URL of the device running Prometheus, from my playbook it is the default of http://localhost:9090.
Then press the plus (+) on the left of the screen and choose to import a dashboard, the board for Node Exporter has ID 1860 (enter 1860 and press load).
Finally press the four squares on the left of the screen, click manage and click on “Node Exporter Full”. The Node Exporter dashboard will now load. There are options for datasource, job, host and port at the top.
Final Result
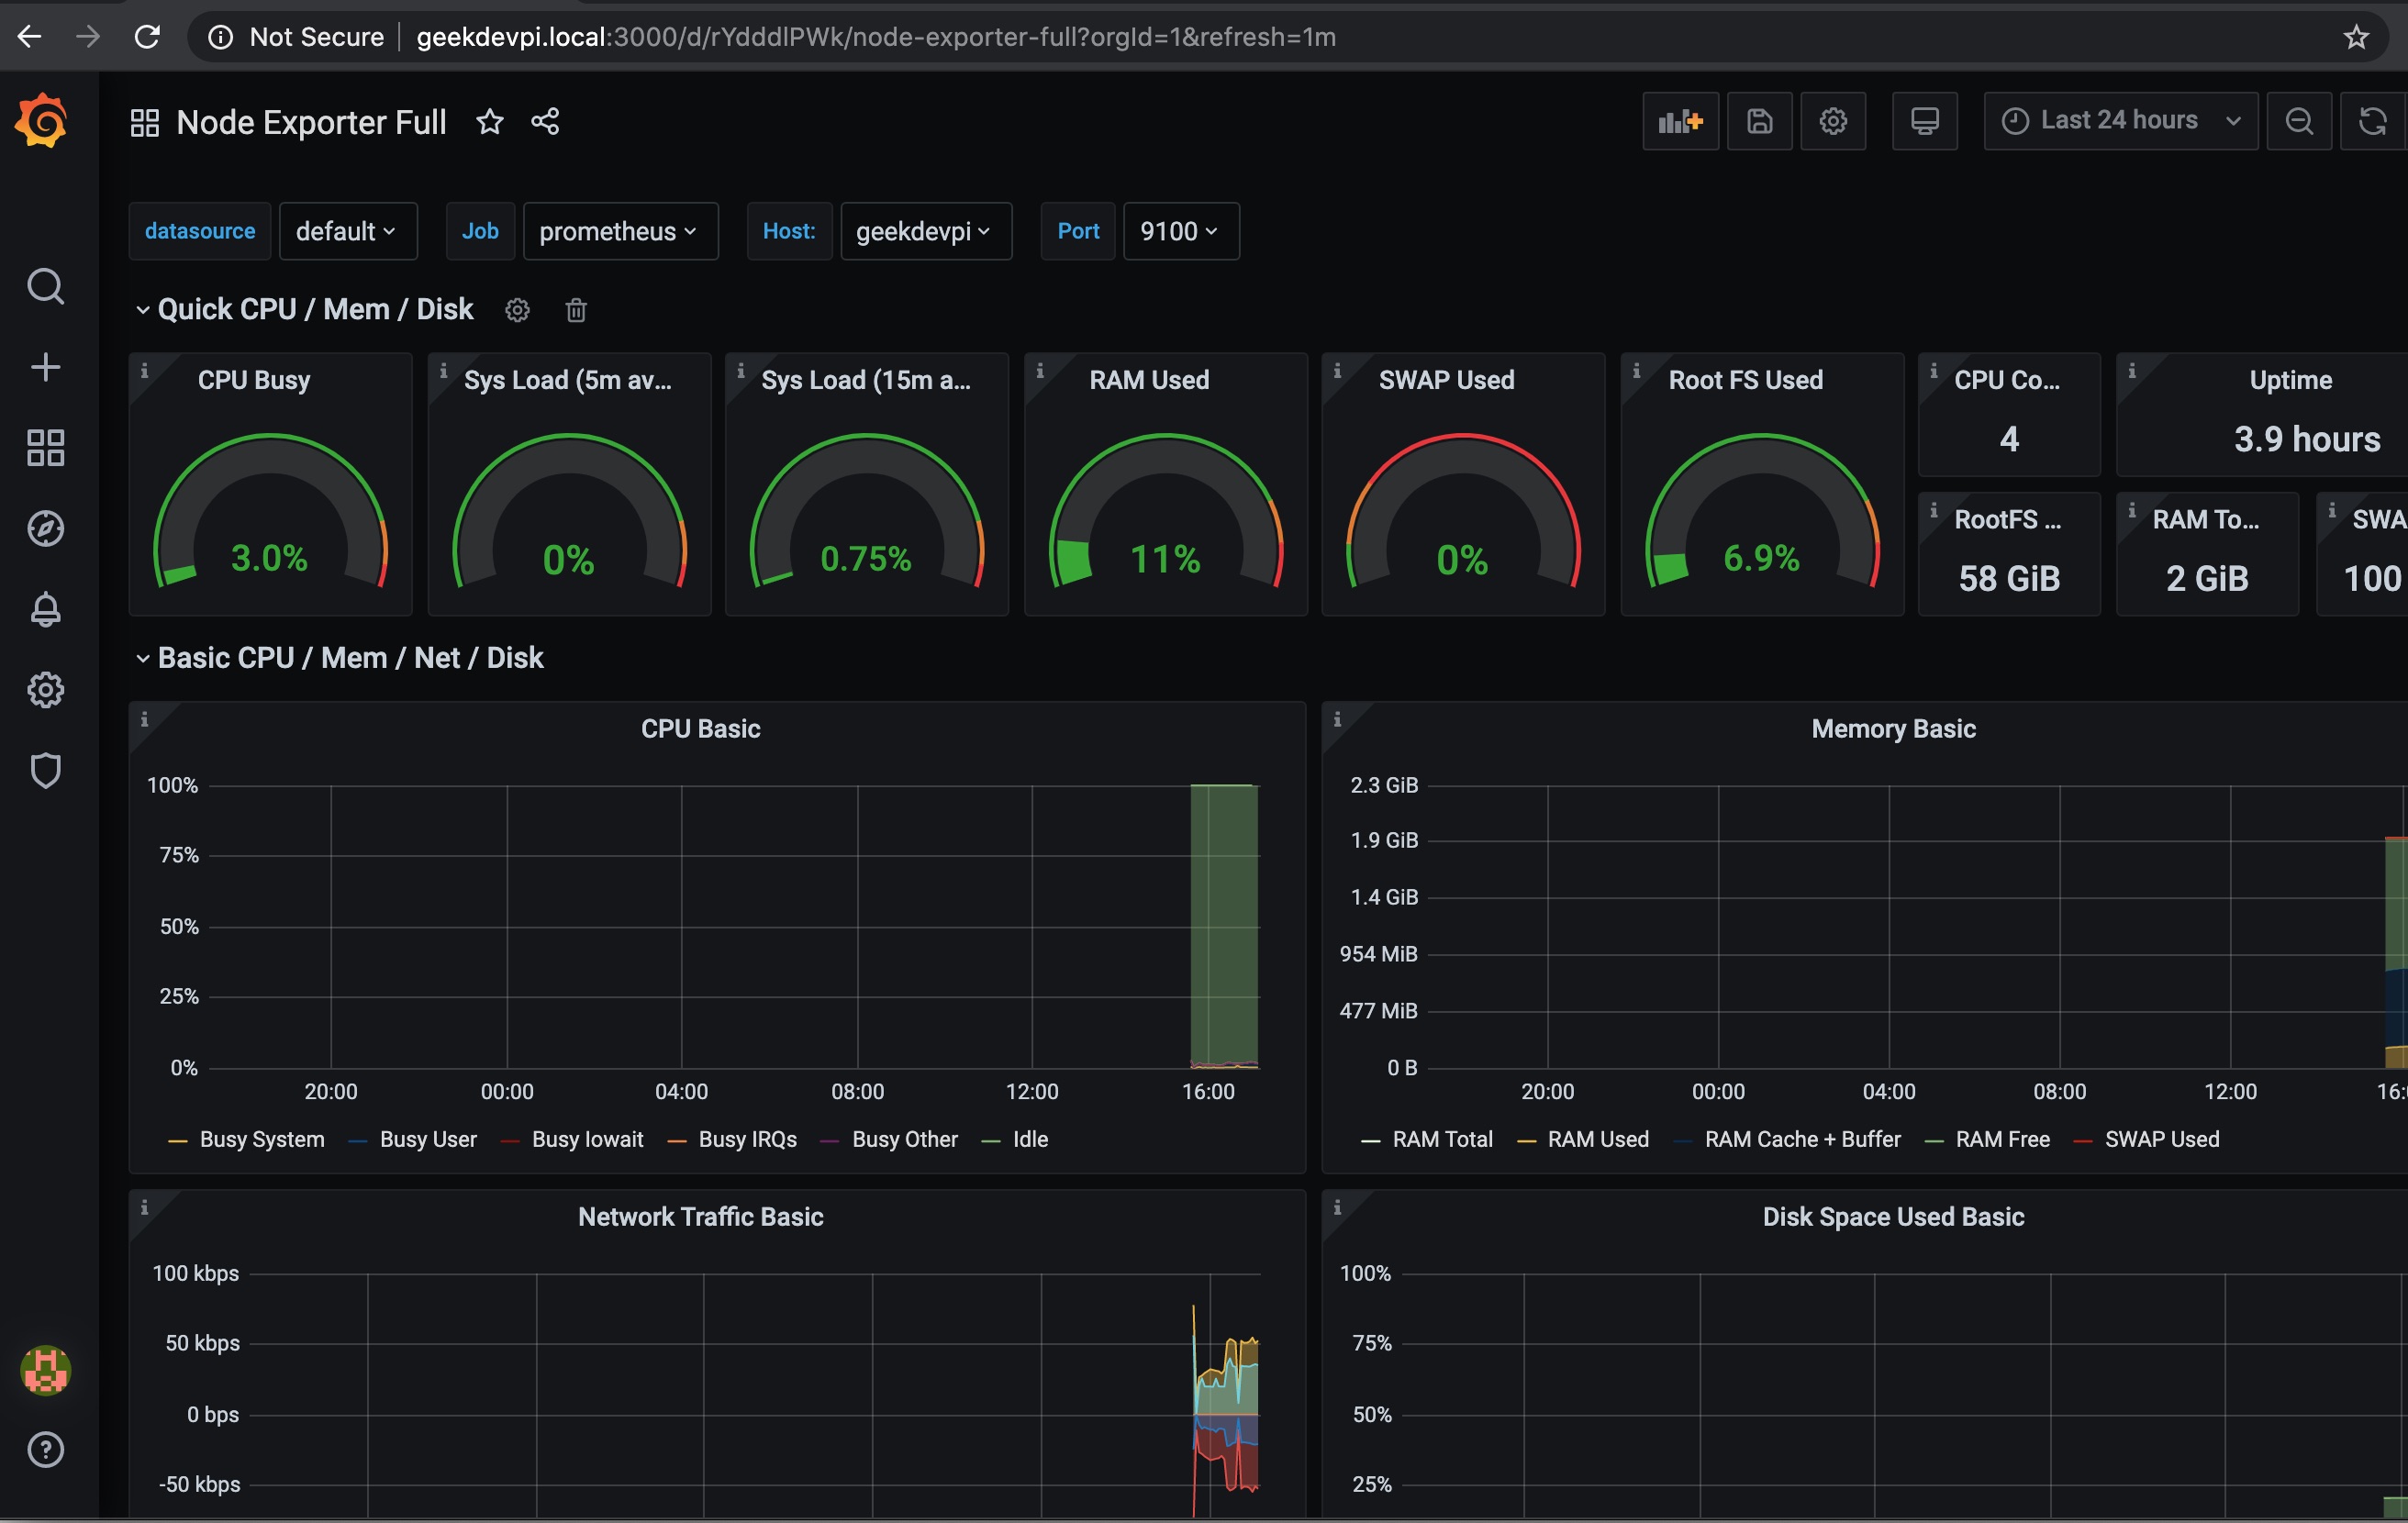
With Grafana and Prometheus up and running, and Node Exporter passing in metrics I can switch between hosts to see the load on each device including:
- CPU usage
- System load
- RAM usage
- SWAP usage
- Uptime

Prometheus can also be accessed via a web browser.


You must be logged in to post a comment.