When discussing data variability (i.e. how much the values vary) there are two methods that can help. These are Sample Standard Deviation and Sample Variance.
Other Terms That Are Needed
Measures of Centre
The middle or centre of the data.
Measures of Spread
How diverse from the Measure of Centre data is, or how concentrated around the Measure of Centre data is.
Ages (A Small Fictional Dataset)
For this blog post I’m going to use a fictional data set (i.e., one I have created) called Ages. Ages contains the following data: 30, 23, 19, 5, 89.
Sample Variance
Pops up whilst working at the Sample Standard Deviation.
Sample Standard Deviation
Typically represented by the symbol S. The formula for Sample Standard Deviation is:
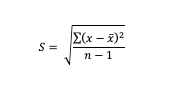
At first this equation looks a bit complicated (well, it did to me), so I’m going to break it down. To do this using my example Ages data set.
Steps
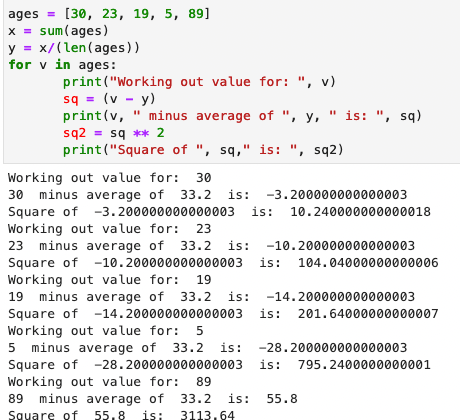
- X (with the line above it) is the average of the data set. To get this all the values are added together (30+23+19+5+89 = 166) and then divided by the number of values (5). The average here is 33.2
- X is the value, so starting with the first value we have (30) we can replace X and X (with line above it) to get (30 – 33.2 = -3.20000000000003)
- This leaves us with negative three point two zero squared or 10.32 (ten point three two).
- The same steps then need carrying out for the other values (23, 19, 5, 89) so that the squares of each value is worked out. Don’t worry, Python can help here (see below).
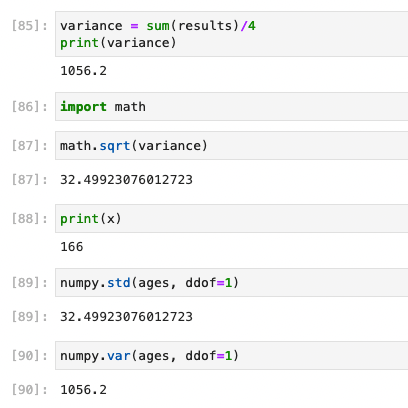
- The results then need adding together (totalling 4224.8), again Python can help with a quick sum() on an array.
- The result (4224.8) then needs to be divided by the number of ages minus one (e.g. 5 – 1 = 4), which gives an answer of 1056.2. This is the sample variance.
- The final step is to work out the square root of the variance (square root of 1056.2), which is 32.49923076012723. This gives us the sample standard deviation.
At this point you may be thinking, that’s a lot of working out (even in Python) to get the the sample standard deviation. Well, yes it can be. However, Python has your back thanks to the Numpy library which includes an option to work out the standard deviation (numpy.std(array_name, ddof=1)) and the variance (numpy.var(array_name, ddof=1)).
Why the ddof=1 option?
By default Numpy works out the population standard deviation and the population variance, which have a different result – i.e., make sure you check which standard deviation and variance are being discussed otherwise prepare for figures to vary.
Standard Deviation Facts:
The standard deviation can never be a negative number, the lowest value it can be is 0 (zero).
The standard deviation is effected by outliers.


One response to “Data Variability: Standard Deviation and Variance (Notes)”
[…] with a jump into Descriptive Statistics vs Inferential Statistics and an attempt to clear up Population vs Sample from my last blog […]
LikeLike