
GitHub maintains a lot of data on activity taking place on GitHub, which means its data rich for a dashboard. Want to know how often a repository sees commits? How long pull requests stay open for? Who the top contributor is? or how long a GitHub Action is taking to run? Then a dashboard can help.
GitHub Dashboard
Rather than clicking through GitHub pages to gather the data, a dashboard allows for it all to be centralised on one page. My example Grafana dashboard for GitHub is being used to show:
- Number of pull requests created
- Pull requests awaiting review
- Number of commits
- A table of commit details
- A list of contributors
- A table of pull request details
- A gauge to show how long a workflow (GitHub Action) is taking to run
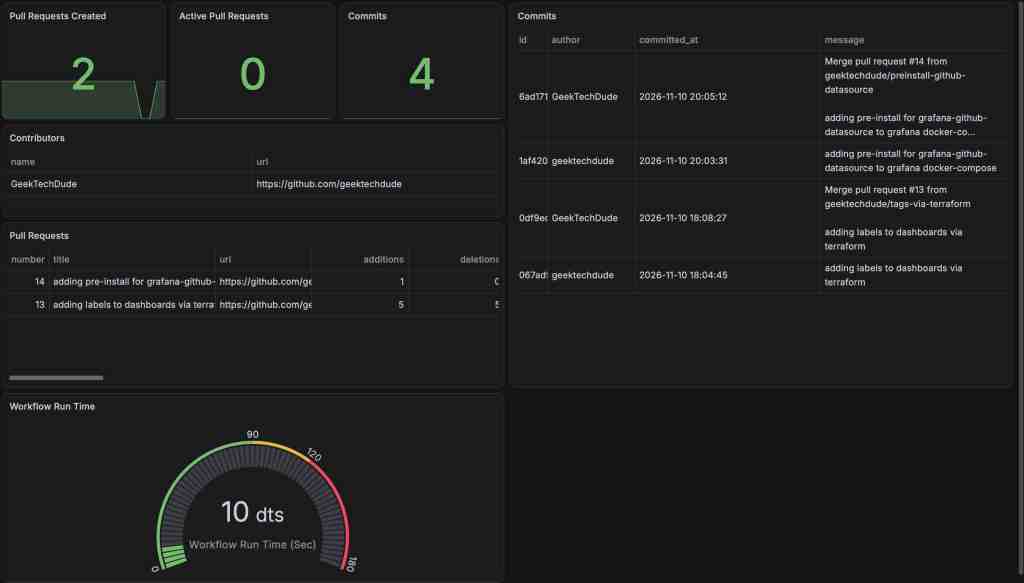
The JSON of the dashboard is stored in my GitHub Repository, it’s over 1000 lines of JSON so a bit too much to post in this blog entry.
GitHub Authentication Required
To use the GitHub dashboard requires some GitHub Authentication. This can either be a GitHub Personal Access Token (PAT) or a GitHub App. Either of these can be set up in the Settings of your GitHub Account. Please make sure to keep the auth details secret once you create them, and where possible make sure to keep the permissions of the PAT/App limited. For my project I’m using a PAT that is limited to read permissions on just my grafana_playground repository.
Docker Environment for GitHub Plugin
I have used an environment variable in my Docker Compose file to install the GitHub Plugin into my Grafana environment:
services: grafana: image: grafana/grafana container_name: grafana restart: unless-stopped environment: - GF_SERVER_ROOT_URL=http://grafana.local - GF_PLUGINS_PREINSTALL=grafana-github-datasource ports: - '3000:3000' volumes: - 'grafana_storage:/var/lib/grafana'volumes: grafana_storage: {}
Terraform To Deploy GitHub Data Source
With the GitHub plugin installed, I am using Terraform to add a GitHub data source so that Grafana can query GitHub. My GitHub token is being stored in a vars file.
resource "grafana_data_source" "github" { type = "grafana-github-datasource" name = "github-geektechstuff" secure_json_data_encoded = jsonencode({ "selectedAuthType" = "personal-access-token" "accessToken" = var.github_token })}
Terraform To Deploy GitHub Dashboard
The GitHub plugin and data source are in place. I can then either add a dashboard manually, installed one from Grafana, or deploy one using Terraform. I am currently using Terraform to deploy my dashboards.
resource "grafana_folder" "geektechstuff" { title = "geektechstuff folder"}resource "grafana_dashboard" "geektechstuff_github" { folder = grafana_folder.geektechstuff.id for_each = fileset("../grafana_dashboards/", "*.json") config_json = jsonencode(merge(jsondecode(file("../grafana_dashboards/${each.key}")), {tags = ["TERRAFORM-MANAGED"]} )) overwrite = true}
View The Code
Want to see how all this fits in with the rest of my Grafana work? It’s all stored in my Grafana GitHub repository.





Leave a Reply